Tracking Peak Oil for several decades resulted in briefing staffs for Senators McCain and Obama in July 2008 (presidential race). Here is data provided to them. A slow emergency grew as US oil production decreased and prices increased until many families used mortgage payments to buy gas to keep their jobs. Only Bud McFarlane saw the risk. In Sept 2008, foreclosures collapsed the banking system.
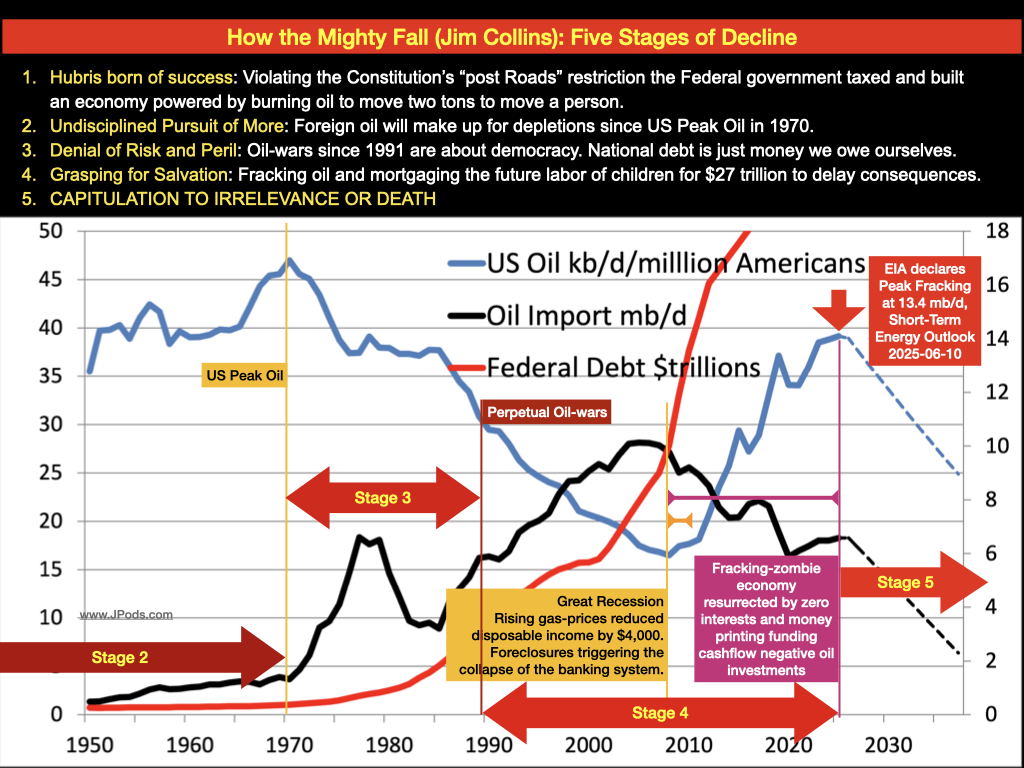
Life requires energy. Oil energy per American (Peak Oil) was in 1970.
The $2,000 a year decrease in disposable income between 2000-2006 matches climbing foreclosures. High gas prices are even bad for oil companies. Gas prices collapsed from $4.11 in July 2008 to $1.75 in December 2008.
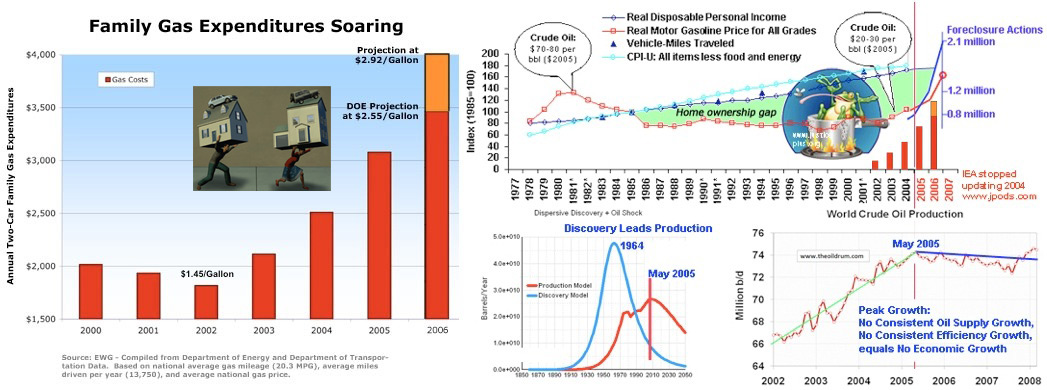
This DOE graph (not updated since 2004) is a great illustration of interaction between oil and paychecks. The dark blue line is steadily increasing disposable income. The red line is oil prices. The gap in the 1990’s allowed people to risk their life’s savings to buy a house. Since oil supplies stopped growing in May 2005, prices shot up to squeeze more and more people into foreclosure.
Gas prices crashed to $1.75 with the 2008 Great Recession. By 2011, gas prices climbed to $3.50 CNBC: Missing $4,155? It Went Into Your Gas Tank This Year. This was what happened in the approach to the 2008 crash. Zero interest rates caused $300 billion to be invested into fracking, so the high 2011 prices decreased as supplies increased.

Warnings and costs:
- 2008, May, Dallas Fed: Crude Awakening: Behind the Surge in Oil Prices
- 2013, Jul, Dallas Fed: Bottom-line Cost of 2007–09 Financial Crisis Estimated at $6 Trillion to $14 Trillion
- 2013, Sep, Dallas Fed: Assessing the Costs and Consequences of the 2007–09 Financial Crisis and Its Aftermath.
- 2022, Sep, Dallas Fed (replaying the crisis of 2008): Dallas Fed Energy Survey. Link to steam roller scene in Austin Powers, geology is slow moving and massive. I think historians looking back on this event will name it Oil Famine. Life requires energy, without greater efficiency, less energy mandates less life.
The metric “Disposable Energy” tracks how much energy people can buy with their take-home pay, how much energy they have to pursue happiness. Here is a comparison of GDP (blue line) with Disposable Energy (red). In the approach to the 2008 Great Recession, GDP gave no warning. Dispoable Energy was warning since 1998.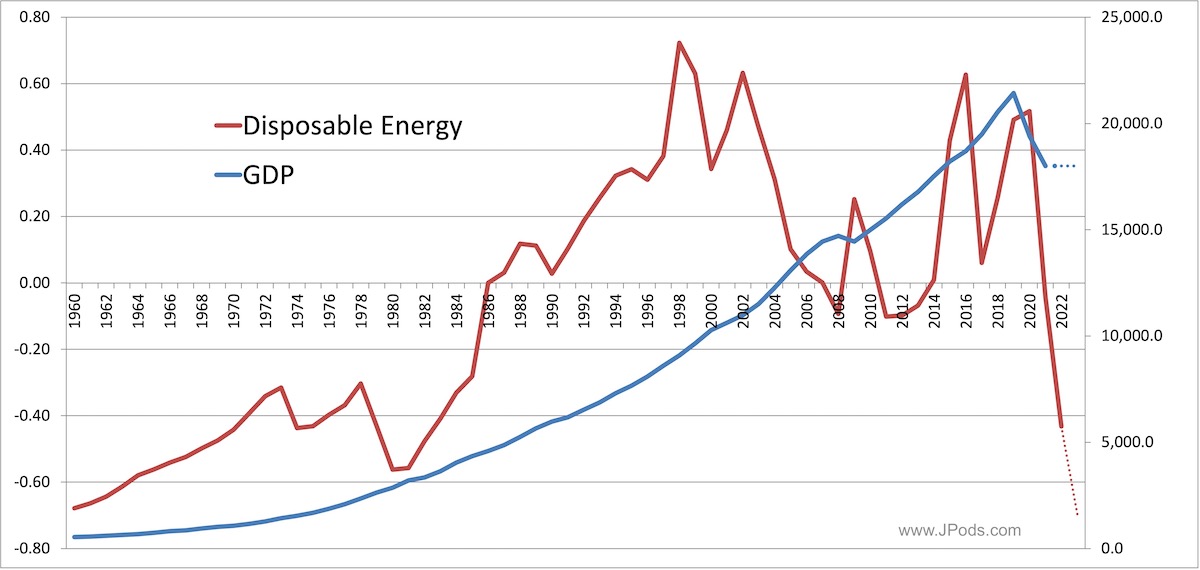
Unemployment is hightly correlated with gasoline prices 18 months prior. Life requires energy. Less affordable energy, less life:
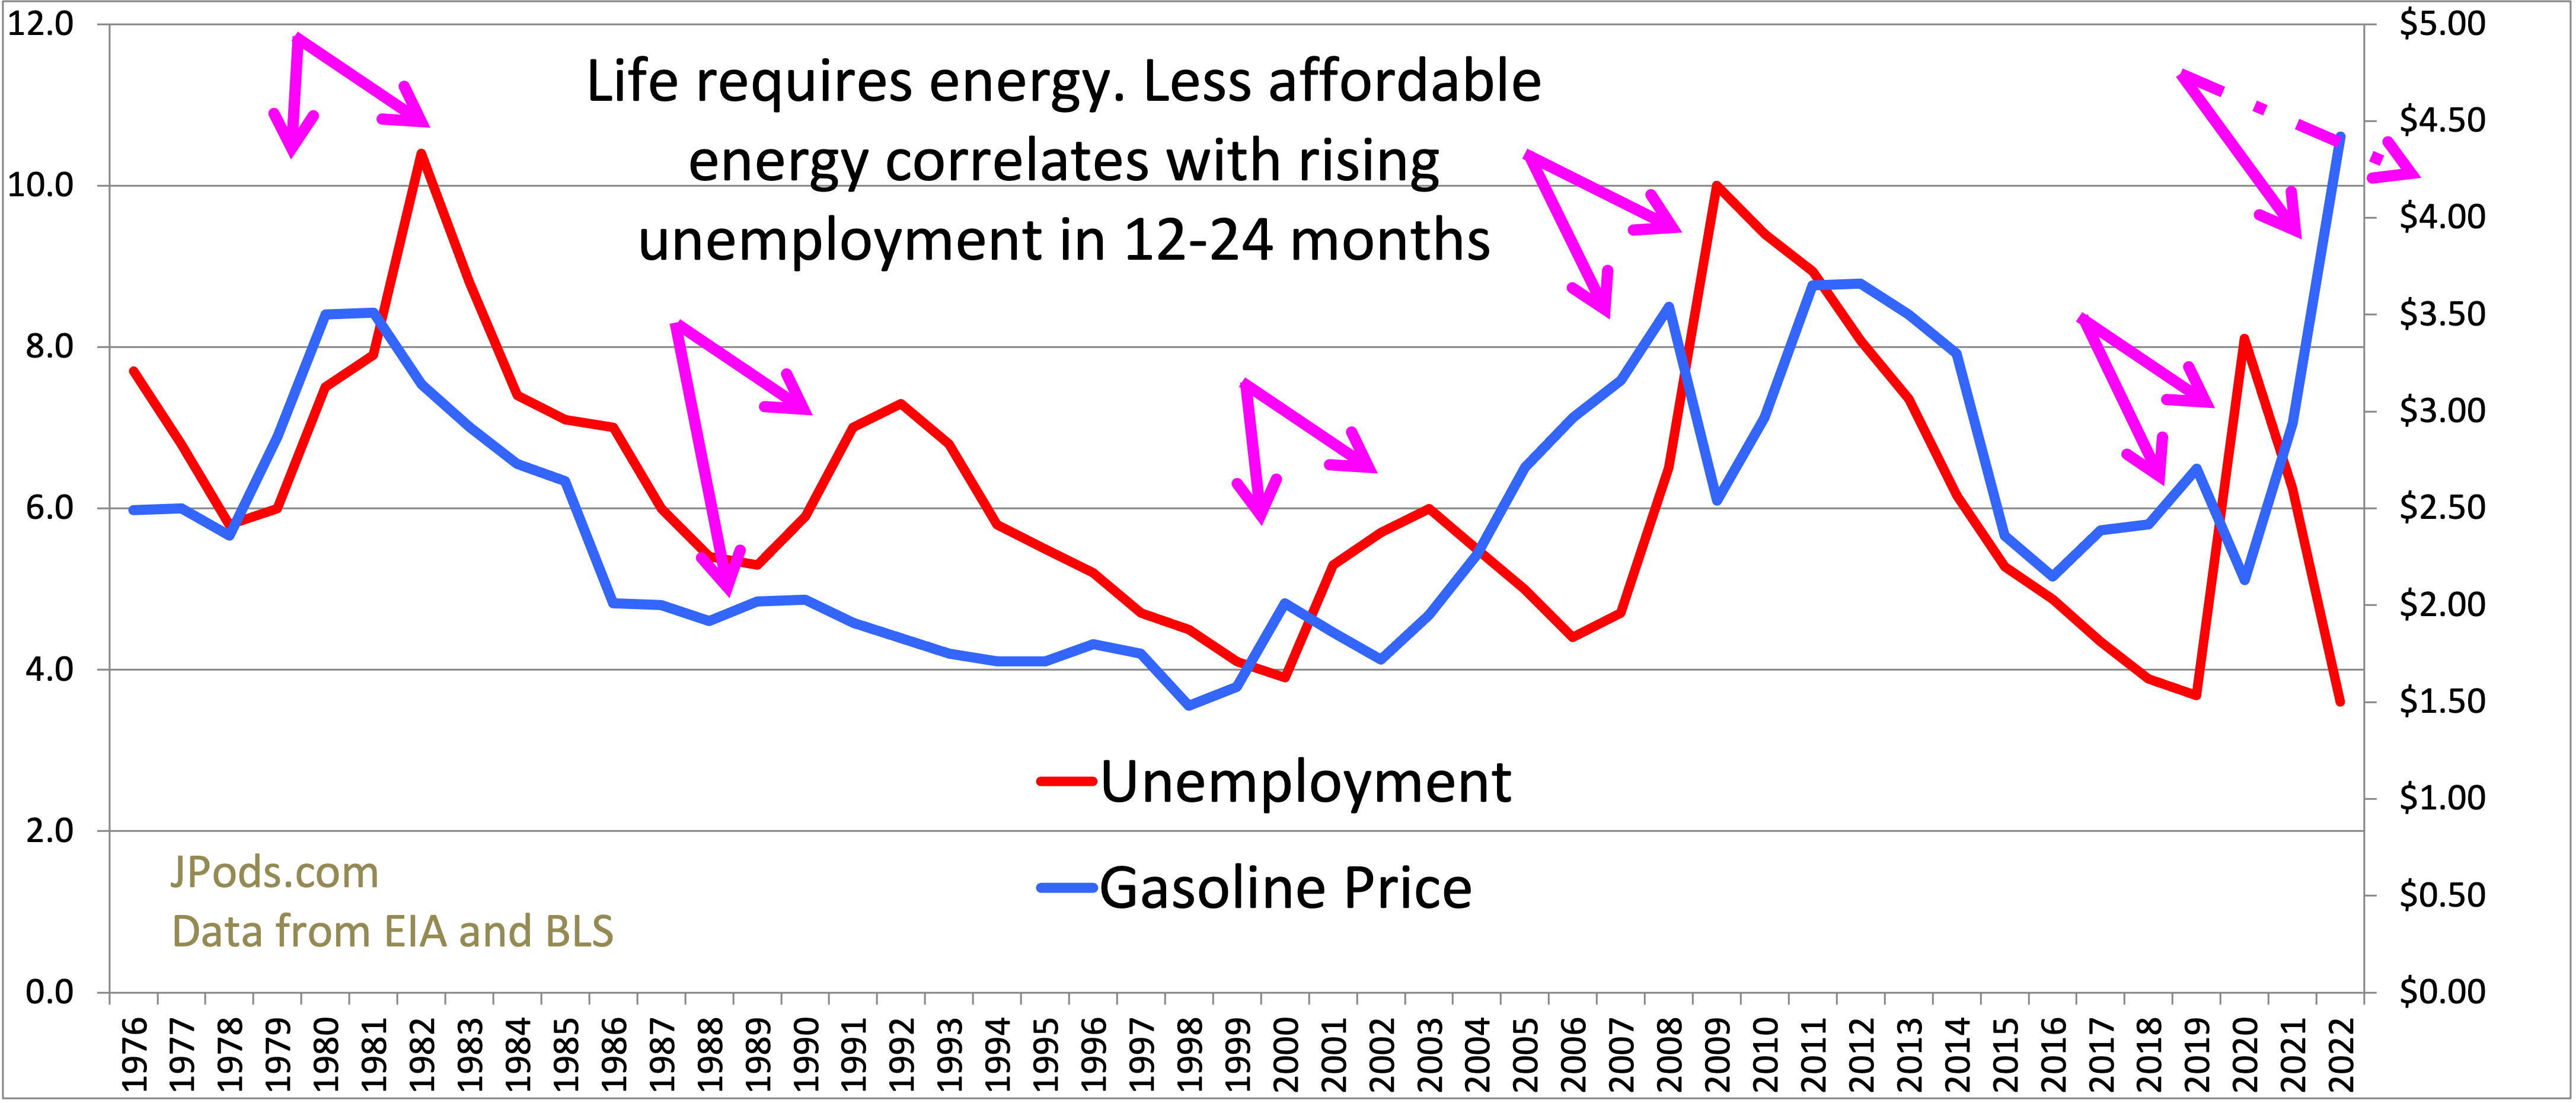
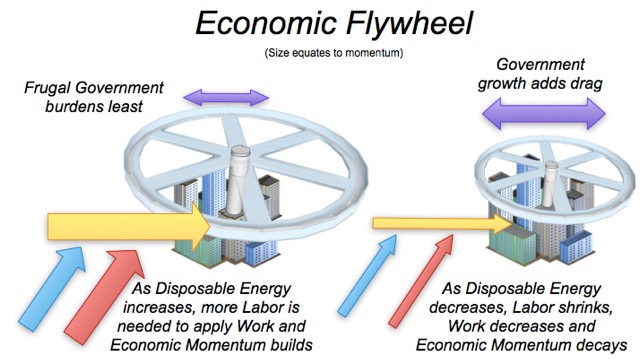
With China and India becoming competitors for foreign oil in 1998, gasoline prices began to rise. Those who “drove to qualify” to buy houses saw their disposable income decrease by $2,000 to $4,500 (CNBC: Missing $4,155? It Went Into Your Gas Tank This Year, gas was $3.50). Forced to choose between keeping their job and sacrificing their home, people used mortgage payments to buy gas for their commute. The momentum in the economic fly wheel decreased until it nealy collapsed in Sept 2008.

Oil wars since 1990 had been known to be unfolding since 1957:
- 2008: Gas prices forced families to use mortgage payments to buy gas to keep their jobs until foreclosures collapsed the banking system, and nearly the economy.
- 1990-on: American soldiers bought time with blood to end foreign oil addiction. Currently, we import 6.5 million barrels per day.
- 1974-on: Every US president declared foreign oil addiction a direct threat to national security.
- 1970, US Peak Oil per capita and triggering foreign oil addiction, oil-dollar funded terrorism, and oil wars.
- 1957, Admiral Rickover: “For it is an unpleasant fact that according to our best estimates, total fossil fuel reserves recoverable at not over twice today’s unit cost, are likely to run out at some time between the years 2000 and 2050”