EIA Forecasting Errors, Repeating Crisis of 2008
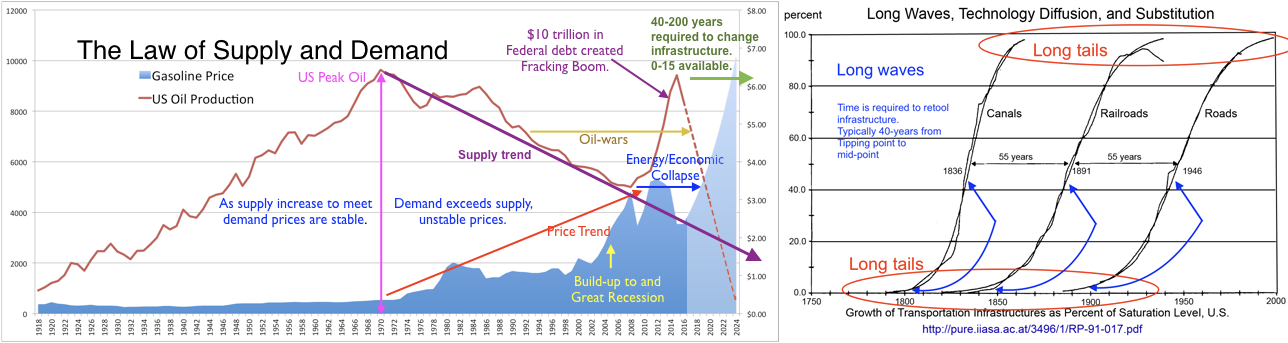
Peak Fracking was finally reported by EIA in April, 2016. This is 18 months after rig counts dropped and 10 months after Peak Fracking. This is a continuation of EIA epic failure to warn the American people of the risks of rising gasoline prices. The Law of Supply and Demand will force gasoline prices radically higher as supply decreases. It requires 40 to 200 years to retool an infrastructure. EIA, DOE, DOD and the entire Federal government should have been aggressively moving away from oil-powered infrastructure since US Peak Oil in 1970.
Morgantown’s PRT network opened in 1975 to provide an example of making American cities independent of foreign oil. Congressional Office of Technology Assessment study PB-244854 warned of “institutional failures” blocking such innovations. The Constitution’s “post Road” restriction was intended to prevent the Federal government from repeating the defects of the King’s transportation monopoly (see Presidential vetoes of “internal improvements”). Federal violation in communications resulted in nearly a century of rotary telephones. Federal violation in transportation as subordinated the survival of America to foreign power, a dependence on debt buying 48% of the oil to feed ourselves. Liberty, not Congress, is the source of the “general welfare.”
There is an information discontinuity between EIA forecasts and EIA data:
- EIA forecasts are for plentiful and growing US oil production with stable oil and gasoline prices through 2017. This is stated in EIA’s May 17, 2016, Annual Energy Outlook 2016 Early and EIA Short-Term Energy Outlook. Graphs for these are in the “Pie-eyed” section below.
- On Aug 22, 2016 EIA web reports 2017 will now experiance temporary 14% decline. ASPO summary.
Production from tight oil in 2015 was 4.89 million barrels per day, or 52% of total U.S. crude oil production. From 2015 to 2017, tight oil production is projected to decrease by 700,000 barrels per day in the Reference case, mainly attributed to low oil prices and the resulting cuts in investment.
No reference is made to E&P bankruptcies, the lead time nor capital required to get 2,000 rigs into the field. EIA is repeating the pattern of reported by the Dallas Federal Reserve later in this page.
- EIA actual data shows a 1 mb/d decrease in US oil production, radical decrease in rig counts, energy sector debt, and political instability in Venezuela, Nigeria, etc….
Key Points
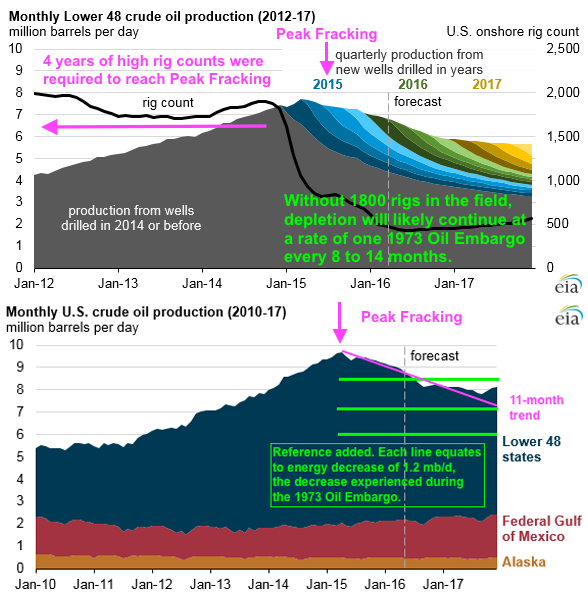
- US Peak Fracking was in June 2015. Since, Peak Fracking, US oil production has depleted at the rate of 1 million barrels per day per year (mb/d/yr), or about one 1973 Oil Embargo per year.
- Production declines will continue as Exploration and Production (E&P) companies are bankrupt and spending 86% operating cashflow on debt to stay alive.
- Unless E&Ps find massive new funding, US production declines of 2.4 to 3.6 mb/d should be expected by the end of 2017.
- The Law of Supply and Demand will force prices much higher as supply decreases.
- When fear awakens in markets, oil trading will shift from “Just-in-Time” to “Just-in-Case”. Currently cars are half empty. When drivers are afraid, they will shift to mostly full causing outages.
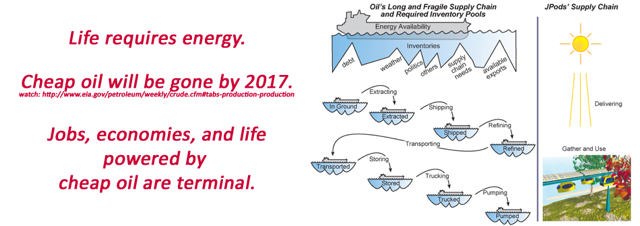
EIA forecasts confuse the need to act far in advance to a crisis to retool infrastructure. It normally takes 40 to 200 years to retool a major infrastructure. Yet governments are assuring us oil will meet needs based on oil fields “Yet-to-be-developed” and “Yet-to-be-found”. So long as you can eat food “Yet-to-be-grown” you will do just fine. When you find you are afraid there may not be food, “Just-in-Time” will switch to “Just-in-Case”.
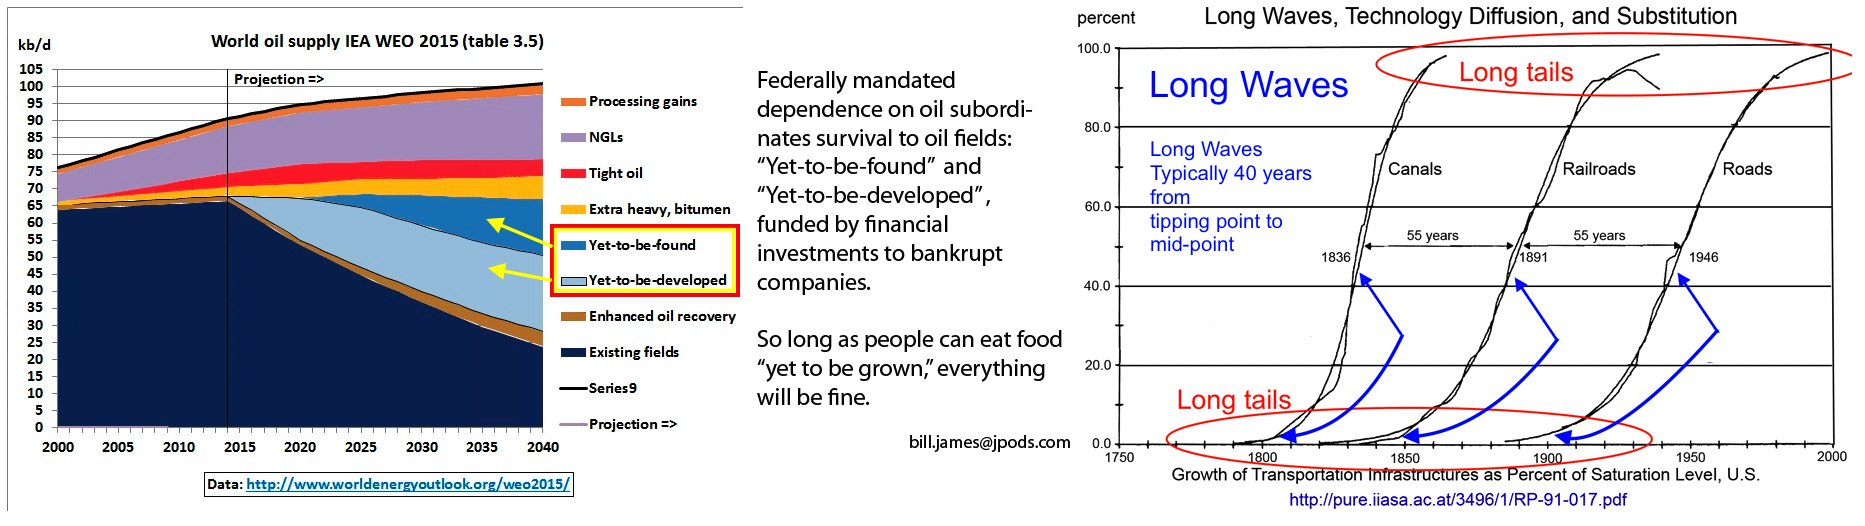
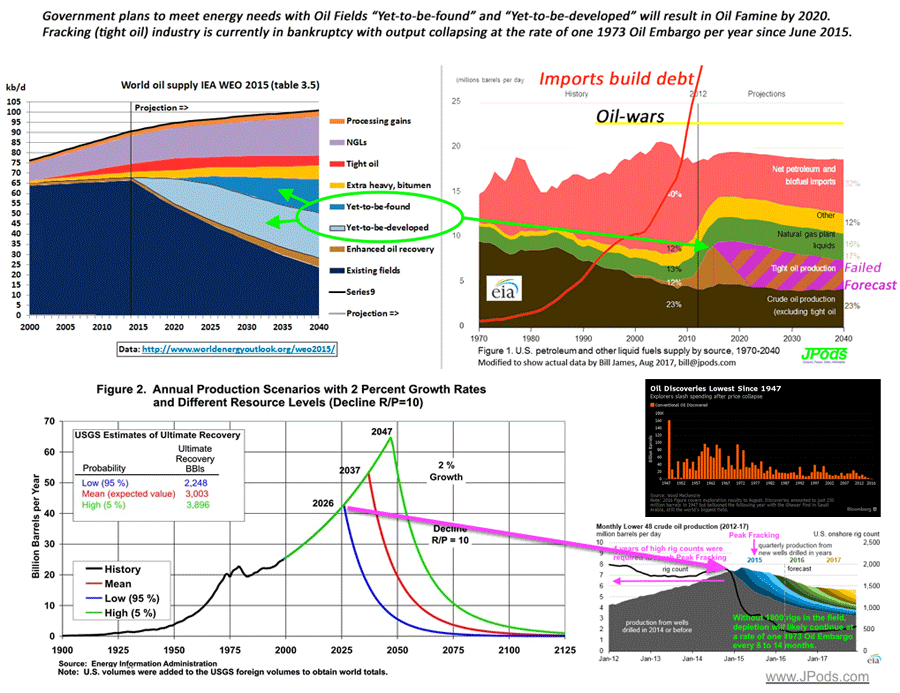
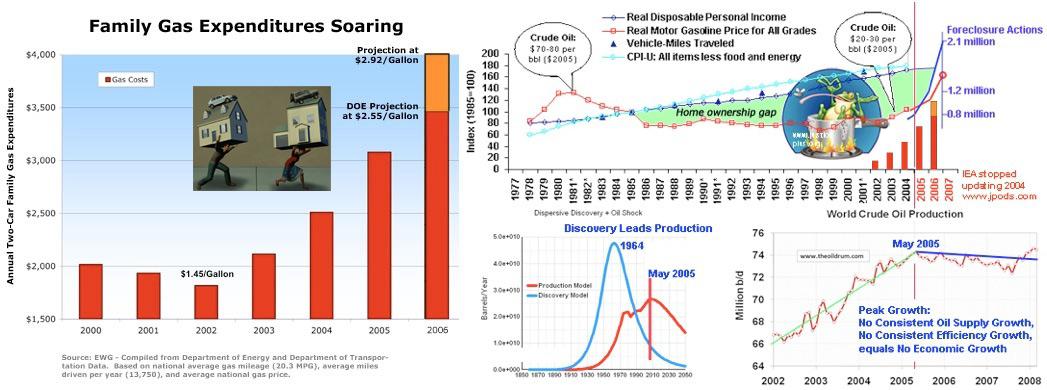
Debt and war accompanied dependence on foreign oil. The following set of graphs illustrate that oil field “Yet-to-be-found” and “Yet-to-be-developed” are not being found or develped. The bottom left graph show EIA expects the entire oil industry to collapse between 2026 and 2046. Know that infrastructure requires 20 to 200 years to adapt, all current investments in oil-powered infrastructure will not have energy to power them. The bottom right graphs showing declines in finding new oil fields (lowest since 1947) and Peak Fracking in June 2015) indicated the collapse of access to oil may have started in 2015. The bankrupcy of the E&P companies indicates that fielding 2,000 rigs to find and develop 5 million barrels per day from fracking has already collapsed. Oil finding and development is capital intensive. Without capital, and profitable companies willing take the risks, oil field “Yet-to-be-found” and “Yet-to-be-developed” seem unlikely.
Fear Can Drive Markets from “Just-in-Time” to “Just-in-Case”
Energy/food is easily traded when there is a surplus, “Just-in-Time.” Energy/food is hoarded when there is a shortage, “Just-in-Case.”
Fear driving “Just-in-Case” was exhibited by drivers in the US Southeast in September 2008. Inventories were very tight as noted in this July 2008 Seeking Alpha article, Gas Lines Coming This Fall.
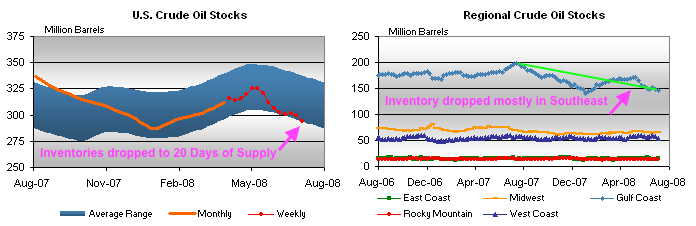
As drivers started seeing plastic bags on pump handles, they shifted behavior from mostly half-empty to mostly-full tanks. Regional uncertainty pulled 15-20 million barrels of gasoline out of the entire US system and a month of gas-lines hit the Southeast.
The graphs below are from the TWIP report and provide two years of data. The left graph shows years 2011 and 2012. The 15-20 million barrel panic draw from September 2008 is shown in the 5-year range highlighted by the Green Circles. The right graph is the current TWIP report. The 2008 inventory draw no longer shows up the current 5-year range.
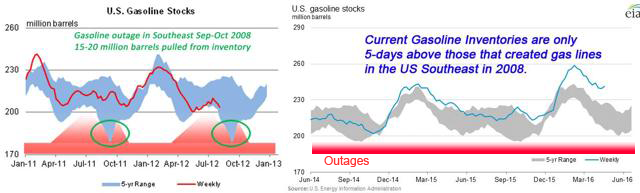
If drivers in the Southeast can pull 15-20 million barrels out of inventory, fear on a national scale can pull 40 to 80 million barrels out of inventory by the 253 million cars in the US. The current “glut” of 240.1 million barrels of gasoline could be reduced to 160 to 200 million by any substantial fear that shifts demand to “Just-in-Case.”
Outages (red areas at the bottom) are possible any day, for any reason, or no reason at all if markets become afraid. The oil “glut” is a storage problem of a highly “Just-in-Time” delivery system.
Repeating 2008 Policy Mistakes
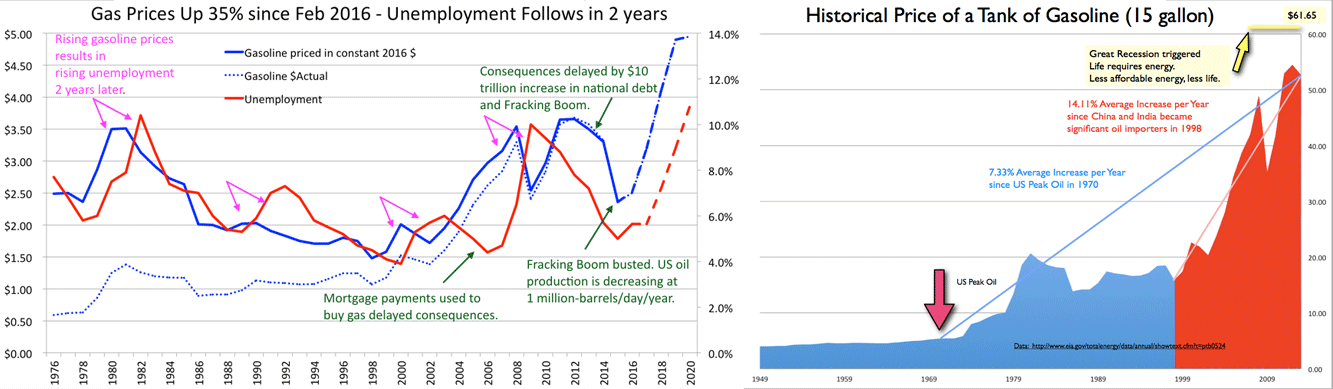
Life requires energy. Less affordable energy, less life. Unemployment is highly correlated to higher gasoline prices two years earlier as illustrated in the following graph. Gas prices are up 35% since February 2016 and going much higher, much faster than most believe as energy policy mistakes of 2000-2008 are repeated.
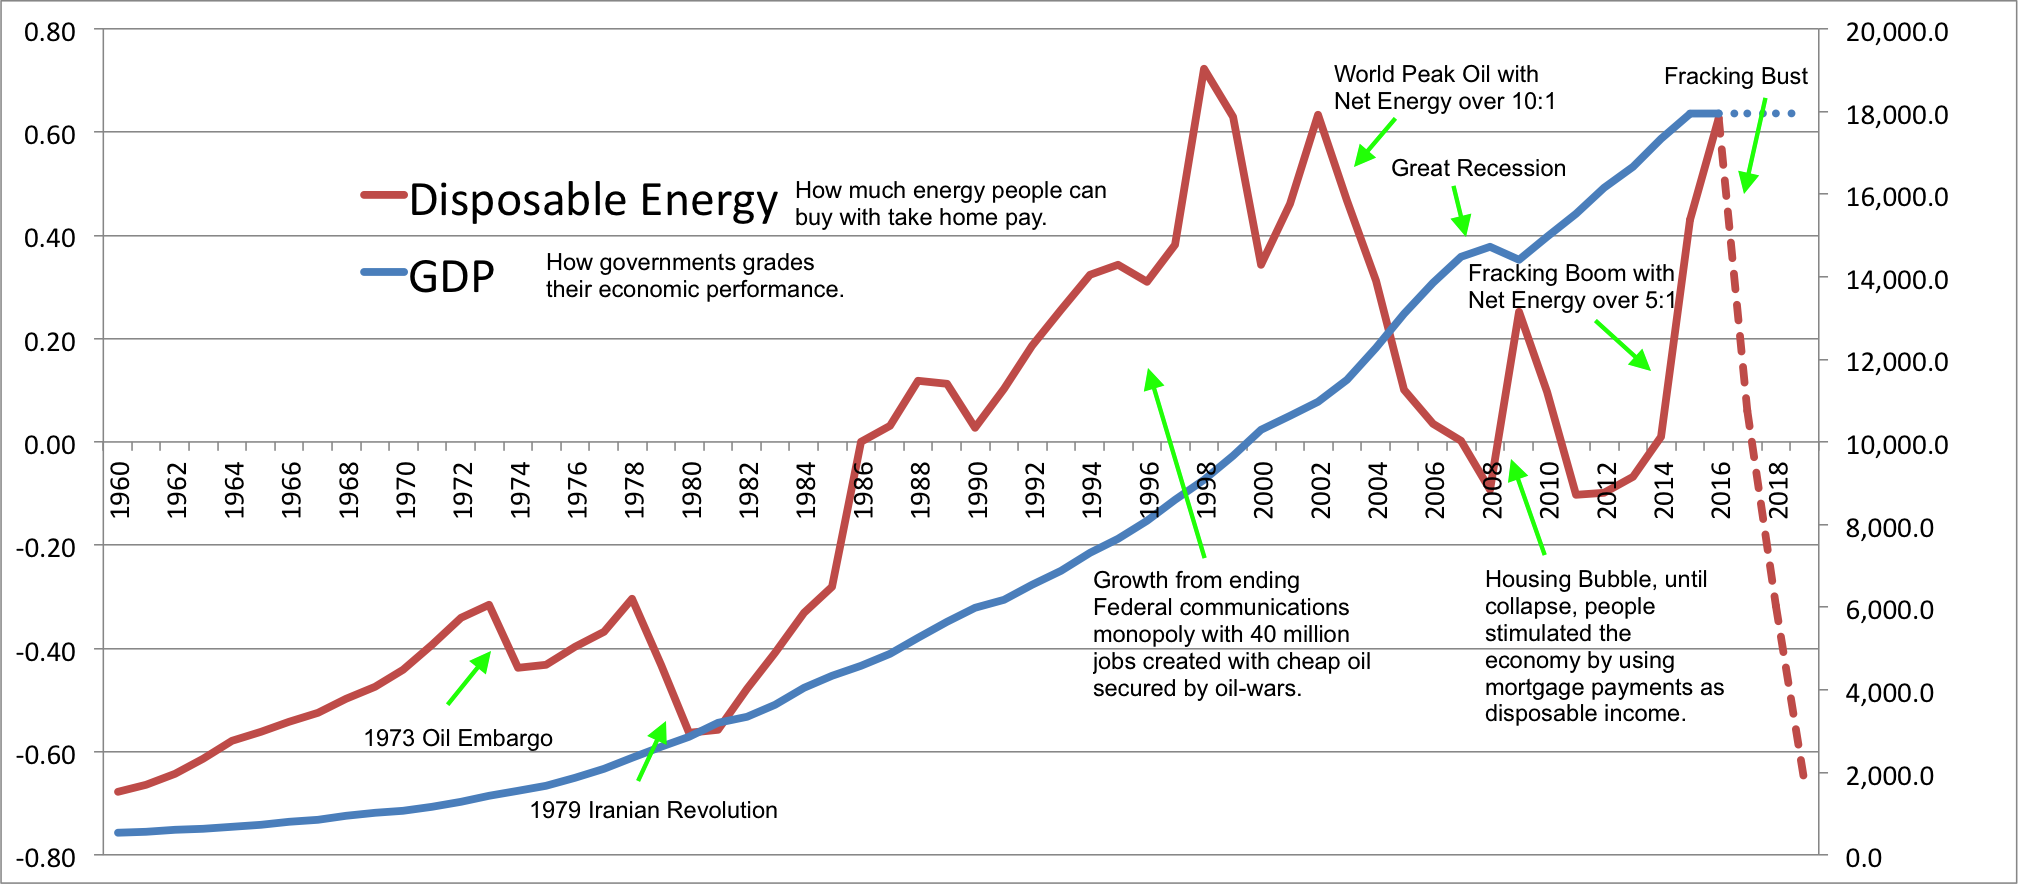
In July 2008, I explained the following set of graphs to staffs for Senators Obama and McCain. As gasoline prices increased between 2000 and 2008, families lost disposable income. Some started using their mortgage payments to buy gasoline to keep their jobs. As missed payments increased, foreclosures exposed bad policies and banking greed. As a side note, except for Bud McFarlane, both staffs thought Federal policies could manage the foreclosure issue. September proved them wrong. DOE stopped updating the graph on the top right in 2004 and has since removed the web page. It shows the difference between disposable income and energy costs. I added data after 2004, bar graphs (left graph) and the frog in the pot of cool water on a fire for the presentation.
These graphs have since been consolidated into a single metric: Disposable Energy. Disposable Energy is a simple metric of how much gasoline Americans can buy with their take-home-pay normalized in 1986.
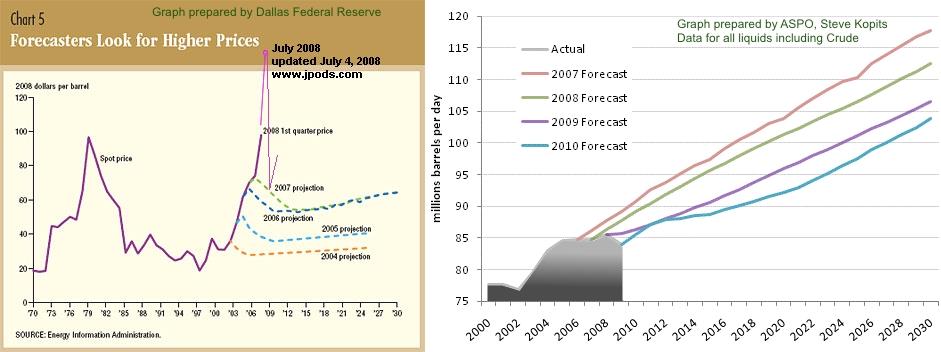
The point for investors is that now, as in 2008 EIA forecasts, were creating an information gap. As gasoline prices increased between 2000 and 2008, as reported by Dallas Federal Reserve and ASPO-USA, EIA repeatedly forecast stable prices and growing supplies.
Forecasts Conflict with Data
Markets are currently trading without fear of shortage, with an understanding there is an oil “glut.”
There is no “glut.” There is a storage problem in the “Just-in-Time” delivery system that drivers can wipe out on any given day by switching to “Just-in-Case.” Drivers are currently unaware that US oil production has dropped by nearly a 1973 Oil Embargo. They are unaware that production will not be restored until 1800 rigs are in the field for two years. Current momentum of US oil logistics is for a 2.4 to 3.6 mb/d drop before much can be done to increase production.
EIA should have warned of US Peak Fracking in early 2015. Belatedly, EIA reported Peak Fracking on April 20, 2016 via web page: “Expected decrease in Lower 48 oil production is partially offset by rising GOM output.” EIA understates the consequences. The title of this web page is like announcing the 9/11 Attacks as “The risk of terrorism decreased today because 19 terrorists killed themselves.”
The graphs on this web page shows a desperate situation for American energy:
- Peak Fracking was in June 2015 at 9.595 mb/d.
- Access to energy is decreasing by most of 1 mb/d per year since Peak Fracking. Down 9.595 mb/d to 8.796.
- Logistics have mass and momentum. About 1800 rigs are required in the field for 2 to 4 years to ramp to production of 9.595 mb/d.
- Frackers are sidelined. Rig counts are down from 1,800 to 404 with Frackers spending 86% of their operating profits on debt.
- Losses of 2.4 to 3.6 mb/d should be expected by 2017. This is 2 to 3 times the resource reduction of the 1973 Oil Embargo.
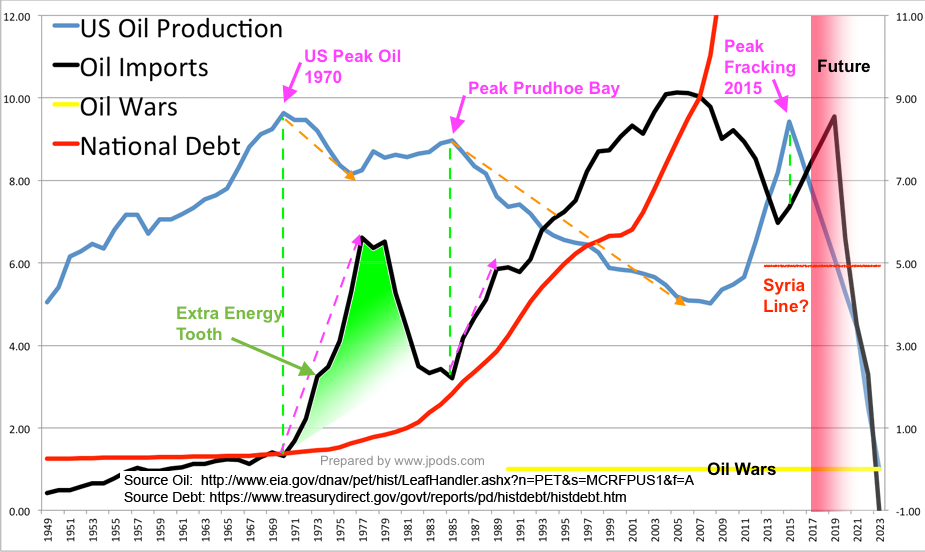
I combined the data from the web page with TWIP reports and historical data to create this overview of the US oil situation. Now that imports are on the rise and US production is falling, any significant news event might waken the market to shift from “Just-in-Time” to “Just-in-Case.”
Pie-eyed 2016 Forecasts
EIA forecasts are repeating the information gap of 2008:
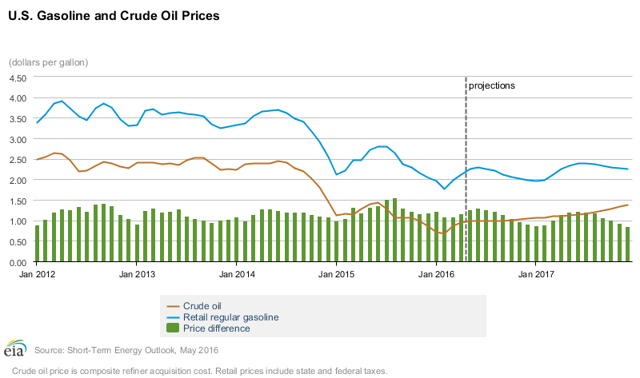
- EIA Short-Term Energy Outlook (May 10, 2016) shows stable oil and gasoline prices through 2017.
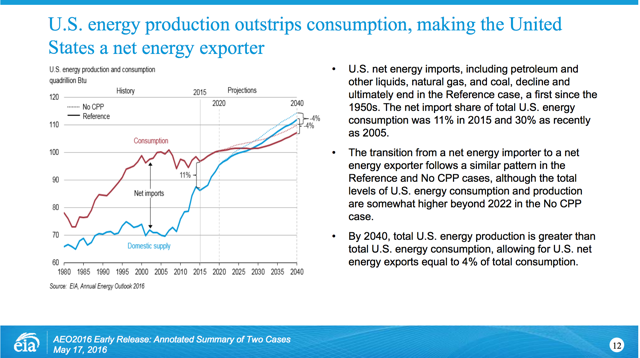
EIA’s May 17, 2016, Annual Energy Outlook 2016 Early shows the US becoming an energy exporter, stable prices, and plentiful supplies.
- EIA reports that US will be a net energy exporter by 2028:
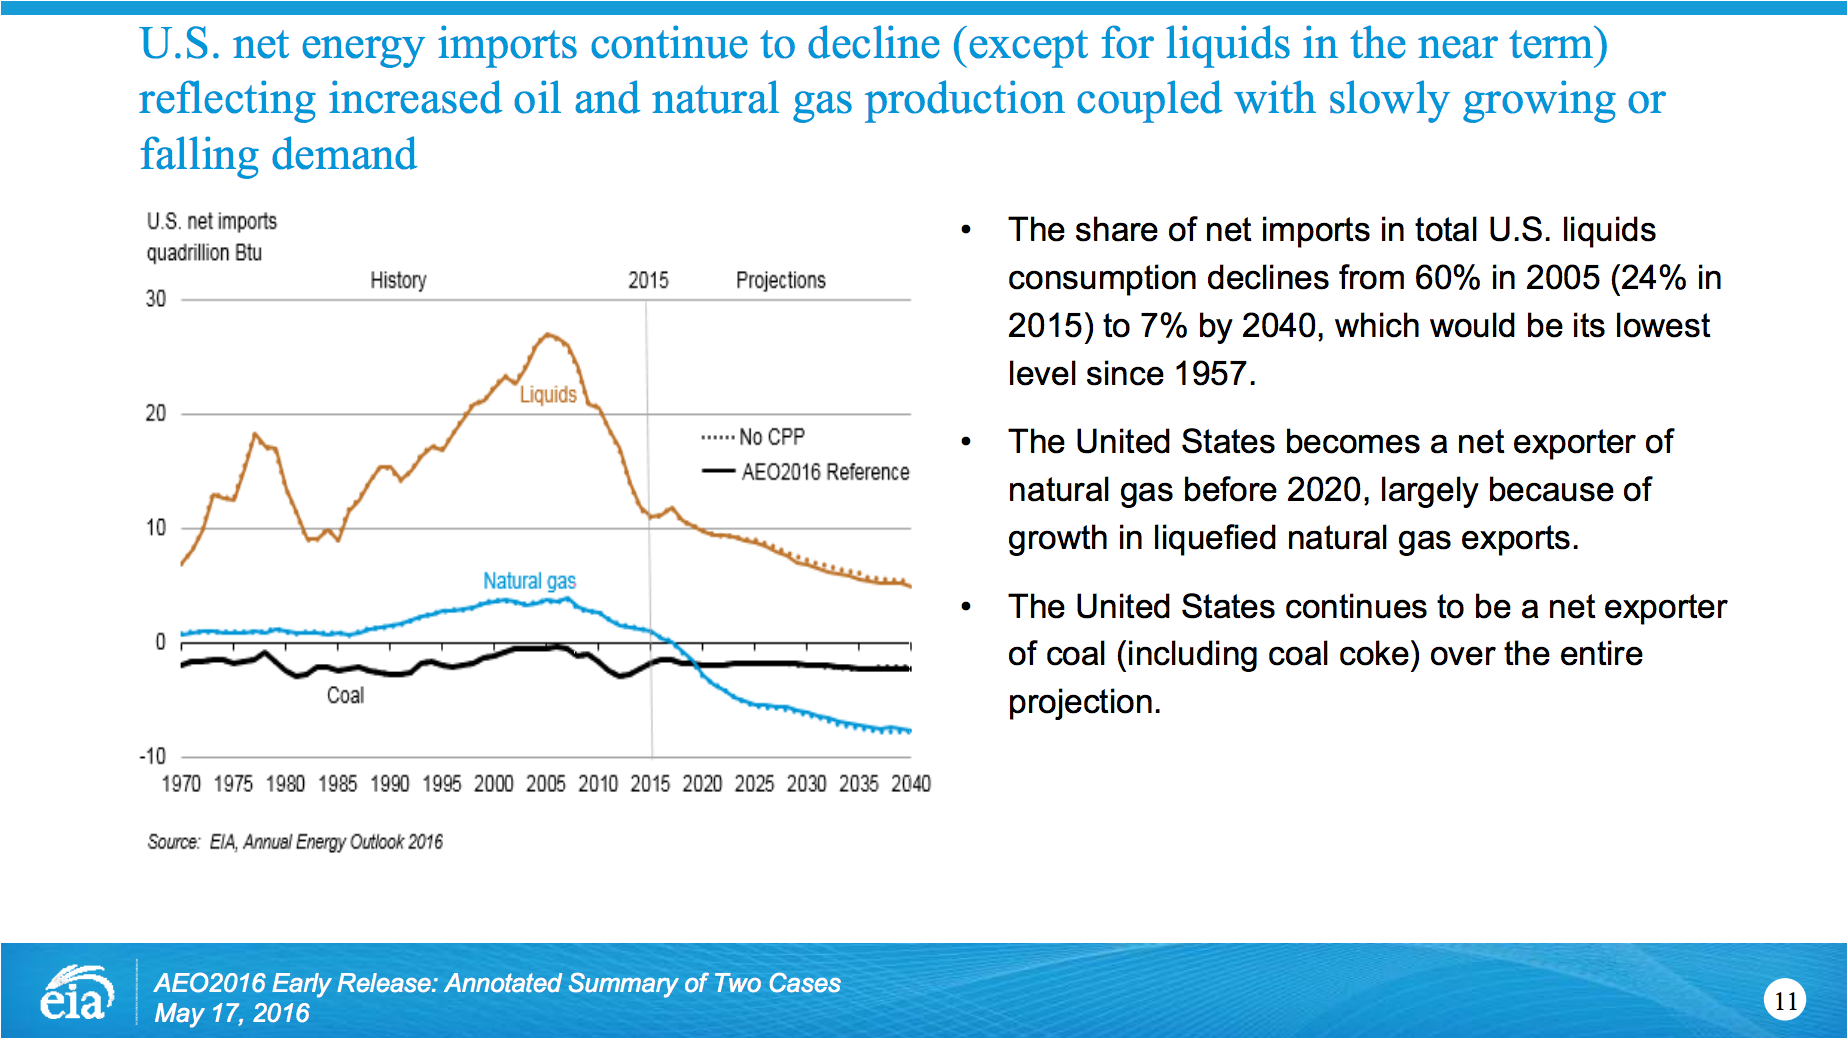
- EIA reports that US oil imports will continue to decline:
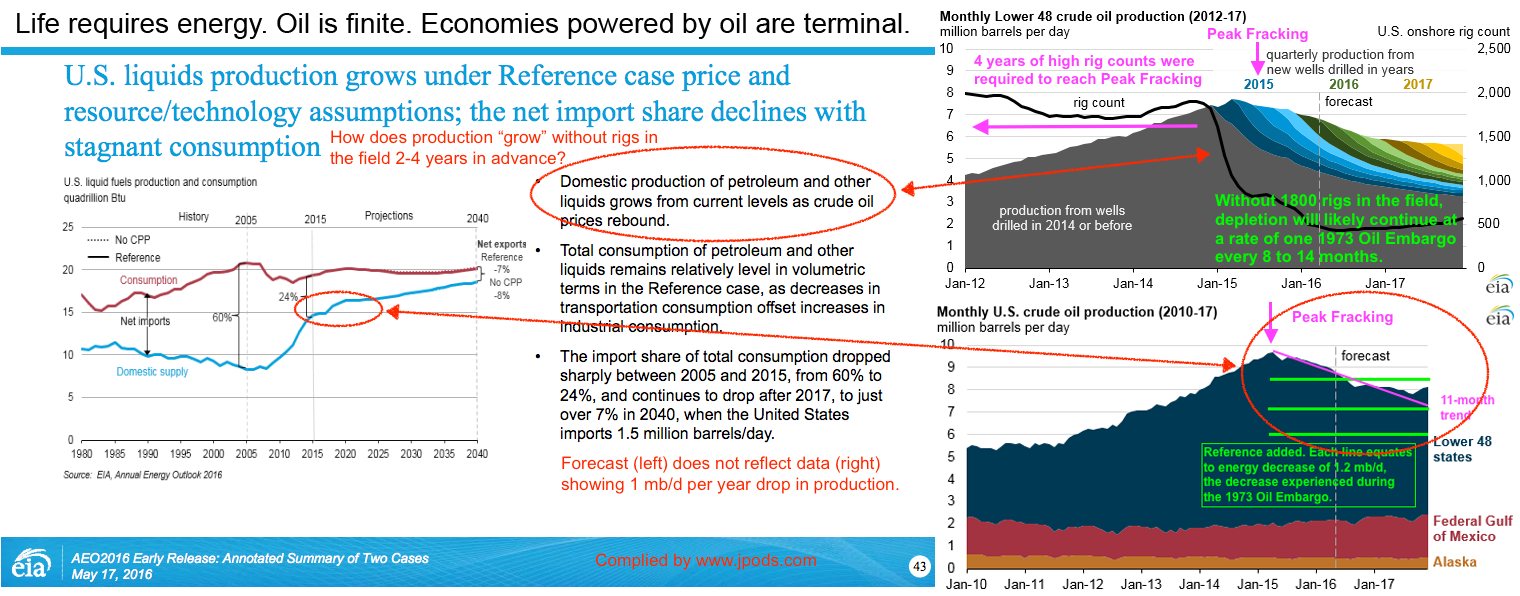
- EIA forecasts US oil production will continue to grow despite lack of rigs in the field and actual production of 1 mb/d per year.
Current energy pricing is based on forecasts of abundance and reports of a “glut.” If the average driver becomes concerned, puts another 6 gallons in his tank, the “glut” evaporates into outages.
Conclusions:
I believe the difference between what EIA is telling markets and what markets are experiencing creates an investment opportunity.
- Experiencing: US oil production is dropping at 1 mb/d, a 1973 Oil Embargo of harm per year since June 2015. Rig counts, debt and lead times seems likely to prevent E&P companies from changing current depletion curves through 2017. Access to energy seems likely to decrease by 2.4 to 3.6 mb/d by the end of 2017.
- Forecasts: EIA’s forecasts show increasing production, decreasing imports, stable costs, abundant supplies.
As soon as drivers become aware of the risks they face are different the forecasts they have been told, the “glut” will evaporate. Saudi Arabia and China already announced a $100 Trillion Shift From ‘Just-In-Time’ To ‘Just-In-Case’.
Background: JPods efforts are to retool urban mobility to not need oil. Our objective is to radically simplify the energy supply chain. JPods networks gather 40,000 vehicle-miles of power per mile of rail per day. Similar energy collection will be practical with Hyperloop, ET3 and other alternative transport networks. Disclosure: I/we have no positions in any stocks mentioned, and no plans to initiate any positions within the next 72 hours. I wrote this article myself, and it expresses my own opinions. I am not receiving compensation for it. I have no business relationship with any company whose stock is mentioned in this article.