Mobility is physical liberty—the capacity to go where we want, when we want, and for why we want. The Division of Labor and pursuit of happiness depend on mobility. Various modes of transport have differ in their mobility capacity.
1. Scale:
A 0 to 5 scale is used to balance clarity and simplicity.
2. Defining the Scale for Each Factor
As recommended by ChatGPT, Perplexity, and DeepSeek.
Availability & Efficiency
| Factor | 0 (Worst) | 5 (Best) |
|---|---|---|
| Hours of operation | <8 hrs/day | 24/7 |
| Delay to board | >30 min | <1 min |
| Travel time (avg speed) | <10 mph | >40 mph |
| Reliability | Frequent failures | Consistently on-time |
Cost & Economic Impact
| Factor | 0 (Worst) | 5 (Best) |
|---|---|---|
| Capital cost to user | >$50,000 (car ownership) | <$100 (bike) |
| Capital cost per user | >$500k (high rail infra) | <$1k (bike) |
| Cost per mile to rider | >$1.00 | <$0.05 |
| Operating cost per passenger-mile | >$1.00 | <$0.05 |
| Funding Source (dependency on subsidies) | 100% subsidized | 100% self-sustaining |
Environmental & External Costs
| Factor | 0 (Worst) | 5 (Best) |
|---|---|---|
| Energy per passenger-mile | >5,000 Wh | <100 Wh |
| CO2 per passenger-mile | >500g | <10g |
| External cost of oil wars | High reliance on oil | No oil dependence |
| External cost of pollution | High emissions | No emissions |
| External cost of health | Major health burden | Net health benefits |
Social & Equity Factors
| Factor | 0 (Worst) | 5 (Best) |
|---|---|---|
| Accessibility | Limited access | Universal access |
| Equity – income | High cost barrier | Affordable for all |
| Equity – age | Not suitable for elderly | Accessible for all ages |
| Equity – disability | No accommodations | Fully ADA-compliant |
| Health impacts | Increases sedentary lifestyle | Encourages active transport |
| Policing exposure | High policing risk | No policing required |
| Social interactions and community cohesion | Isolating | Encourages interaction |
Urban & Infrastructure Impact
| Factor | 0 (Worst) | 5 (Best) |
|---|---|---|
| Walkability impact | Reduces walkability | Increases walkability |
| Parking impact | Large footprint | Minimal or no parking needed |
| Congestion | High congestion creator | Reduces congestion |
| Safety | High accident risk | Extremely safe |
| Land use impact | Encourages sprawl | Encourages dense, mixed-use areas |
| Energy resilience | Grid-dependent fossil fuels | Fully renewable |
3. Combining the Scores
Each mode of transportation will receive a score between 0 and 5 per category. To get a final mobility score, we sum the weighted scores: Mobility Score=∑(Factor Score×Weight)\text{Mobility Score} = \sum (\text{Factor Score} \times \text{Weight})
Weights can be adjusted depending on priorities. For example:
- Environmental concerns → Higher weight on energy & CO2.
- Equity focus → Higher weight on accessibility & income equity.
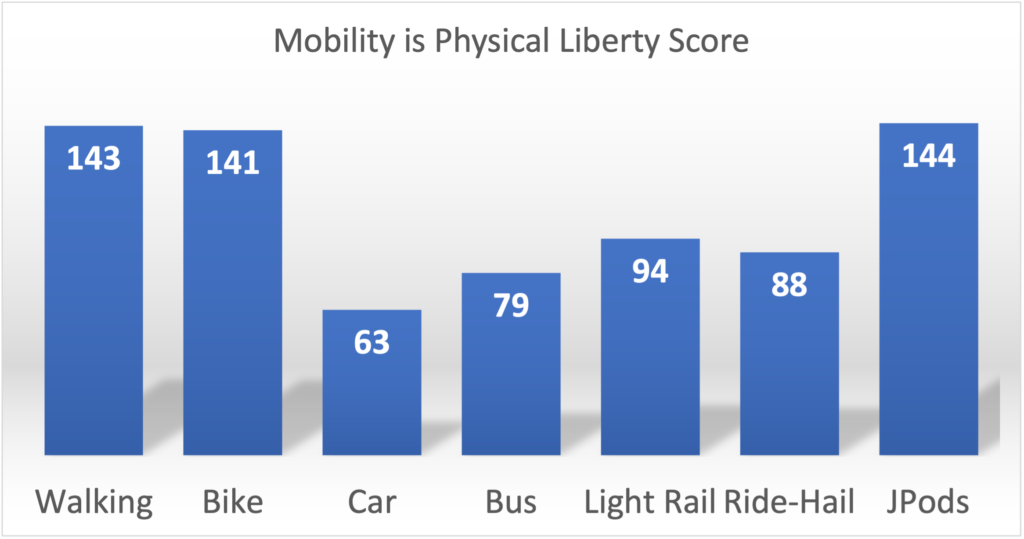
Here’s a table with estimated values for each mode of transportation based on the 0 to 5 scale. These are approximate values and can be refined with more data.
Observations:
- Walking and biking score highest in environmental impact, affordability, and urban benefits but lower in accessibility for all ages and disabilities. Walking and biking can be made 400% safer by changing policies (see graph below of how car-centric highway polices in the US, Sweden, and Denmark diverged after the 1973 Oil Embargo.
- Cars score well in availability and personal convenience but rank lowest in cost, environmental, and congestion-related factors. Delay to board is time spent parking.
- Public transit (buses & light rail) is mixed—affordable but dependent on taxing non-users for subsidies, moderately accessible, and has medium environmental impact. See Parasitic Energy Ratio.
- Ride-hail (Uber, Lyft) is convenient but expensive and contributes to congestion.
- JPods outperform in efficiency, cost, environmental impact, and urban benefits, but real-world data is needed for validation.
Pedestrian and bike safety scores would be higher if the US adopted the highways policies of Sweden and Denmark following the 1973 Oil Embargo. Prior to the Embargo all three nations had the same car-centric highway policies, oil use per person, and safety record.

Comparison: Including Road Capital Costs for Cars & Buses
| Mode | Capital Cost ($/pass-mi) | Road Capital Cost ($/pass-mi) | Operating Cost ($/pass-mi) | Total Cost ($/pass-mi) | Fare Paid ($/pass-mi) | Farebox Recovery |
|---|---|---|---|---|---|---|
| Light Rail | $0.65 | N/A | $1.00 | $1.65 | $0.45 | 27% |
| Bus | $0.20 | $0.15 | $1.50 | $1.85 | $0.35 | 19% |
| Car | $0.10–$0.20 | $0.05–$0.10 | $0.40–$0.80 | $0.55–$1.10 | $0.81/car-mile | 100% (user-paid) |
| JPods | $0.10 | N/A | $0.20 | $0.30 | $.55-$2.11 | 100% |
Additional Considerations:
- Road Capital Cost for Buses:
- Buses depend on roads, so we must allocate a portion of road construction and maintenance to them.
- Highways cost about $5M–$20M per lane-mile, with buses using mixed-traffic lanes.
- Approximate road cost per bus passenger-mile: $0.15.
- Road Capital Cost for Cars:
- Roads cost about $0.05–$0.10 per car passenger-mile (based on U.S. road expenditure and vehicle miles traveled).
- This excludes externalities like congestion, parking, or fuel taxes, which may offset or add to the cost.
- JPods and Light Rail Avoid Road Costs:
- JPods have a dedicated grade-separated infrastructure, reducing road maintenance burdens.
- Light rail operates on its own right-of-way or shared lanes, so road costs aren’t directly assigned.
Key Takeaways:
- Buses have the highest total cost ($1.85 per passenger-mile), with low farebox recovery (~19%).
- Cars appear lower in cost ($0.55–$1.10 per pass-mi), but users fully cover expenses.
- JPods are the lowest-cost mode ($0.30 per pass-mi) with potential for self-sufficiency.
- Light rail is expensive ($1.65 per pass-mi) but receives significant subsidies.
Question you may ask ai engine:
Please create a table of metrics for mobility that can be used to compare modes of transportation with the following factors. Foundation is that mobility is physical liberty, the capacity to go where we want, when we, for why we want. The Division of Labor and pursuit of happiness depends on mobility. For efficiency, use the following wh/passenger-mile from https://tedb.ornl.gov: cars 1,032, buses 1,245, light rail 818, bikes 25, and JPods 78. CO2 is highly correlated to energy used. If you cannot find better cost data, here is cost per passenger-mile:
Trains: $.65 capital cost, $1.00 operating cost, $.45 fare paid by passenger
Buses: $.20 capital cost, $.07 road cost, $1.50 operating cost, $.35 paid by the passenger
Cars: $.15 capital cost, $.07 road cost, $.65 operating cost, $.81 paid by passenger
JPods: $.10 capital cost, $.20 operating cost, fare paid by the passenger.
Create a scoring table from 0 for worst to 5 for the best for the following Factors. Example
Hours of Operation 0(worst) <8 hours per day and 5 (best) 24/7
Factors
Availability & Efficiency
- Land use impact
- Density of availability
- Adaptability
- Hours of operation
- Delay to board
- Travel time (avg speed)
Reliability
- Cost & Economic Impact
- Capital cost to user
- Capital cost per user
- Cost per mile to rider
- Operating cost per mile
- Funding Source (subsidies)
Environmental & External Costs
- Walking
- Energy per passenger-mile
- Energy security
- Energy resilience
- CO2 per passenger-mile
- External cost of oil wars
- External cost of pollution
- External cost of health
Social & Equity Factors
- Equity – income
- Equity – age
- Equity – disability
- Health impacts
- Policing exposure
- Social interactions
Urban & Infrastructure Impact
- Walkability impact
- Parking impact
- Congestion
- Safety