Payback will be Project by Project
AI summary of the payback for your city.
Generic information on traffic costs and paybacks are provided. But projects will be funded Project by Project. Each will have its own supporting data, cost, regulatory, and payback data. Link to specific example networks.
Morgantown 2010 Audit on the payback of that 1972 technology relative to buses. Computers are multiple 10x more capable today.
Traffic costs:
Americans spend $2.76 trillion/year to sit in traffic jams and waiting for mass transit:
- $756 billion per year for oil.
- $871 billion per year in accidents, alternate data source.
- 40,100 road-deaths in 2017.
- 2.31 million injuries in 2013.
- $305 billion per year in congestion.
- $109 billion per year in car damage from poor road maintenance.
- $723 billion per year in land use at $1 per square foot per year (cost of a garden plot, apartments are normally $2-5 square foot per month with multiple floors in a single square foot of land).
68% of car miles in the US are driven in cities (JPods’ market niche). Each car costs a family about $9,282, is parked 95% of the time with ~85% of car costs leave the local economy. 2.24 cars per household (278.06 million cars, 124.01 million households)

Detailed Payback Calculations
Strong Towns
- Strong Towns ROI video on development investments.
- Strong Towns Growth Ponzi Scheme
- Strong Towns Growth versus Productivity, $1.1 million versus $0.6 million rundown versus modernized, same ratio downtowns versus big box stores. Poor neighborhoods often provide more taxes per acre than wealthy neighborhoods. 12:57, the more reliant on the automobile the less financially productive.
- UrbanThree case studies
About $1 trillion per year of costs can be recovered as value (customer savings and profitable revenue). Link to PowerPoint and KeyNote presentation. There is over a $trillion per of waste that can be converted to profits and customer savings by repeating in transportation the success of restoring communication infrastructure to free markets in 1982.
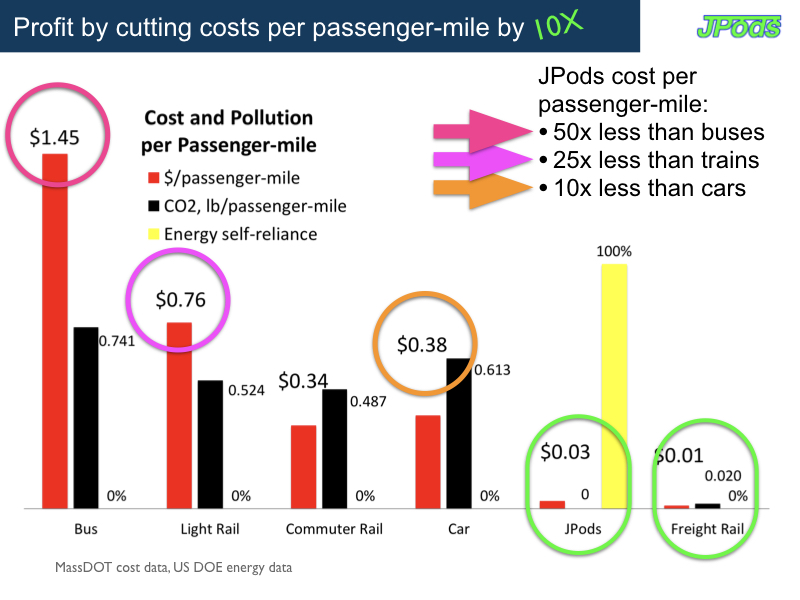
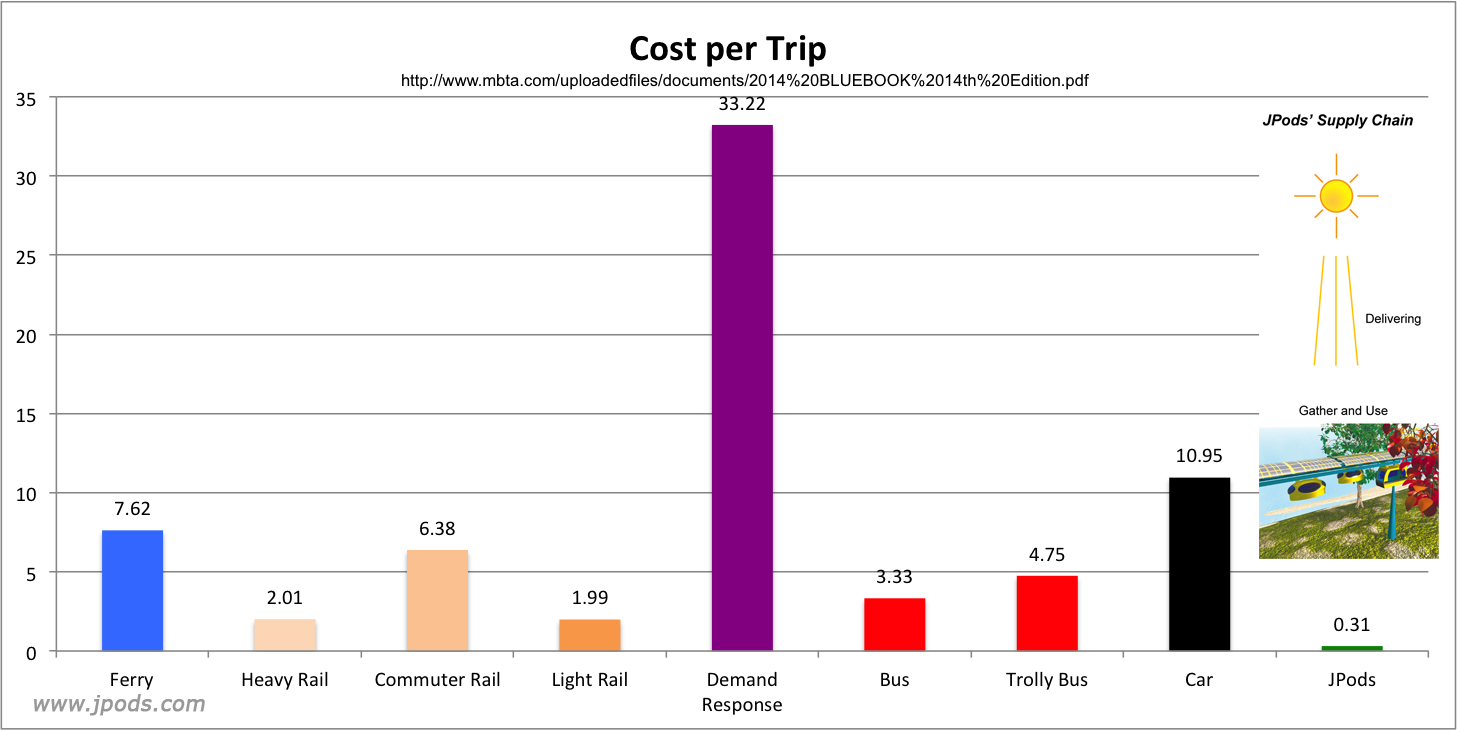
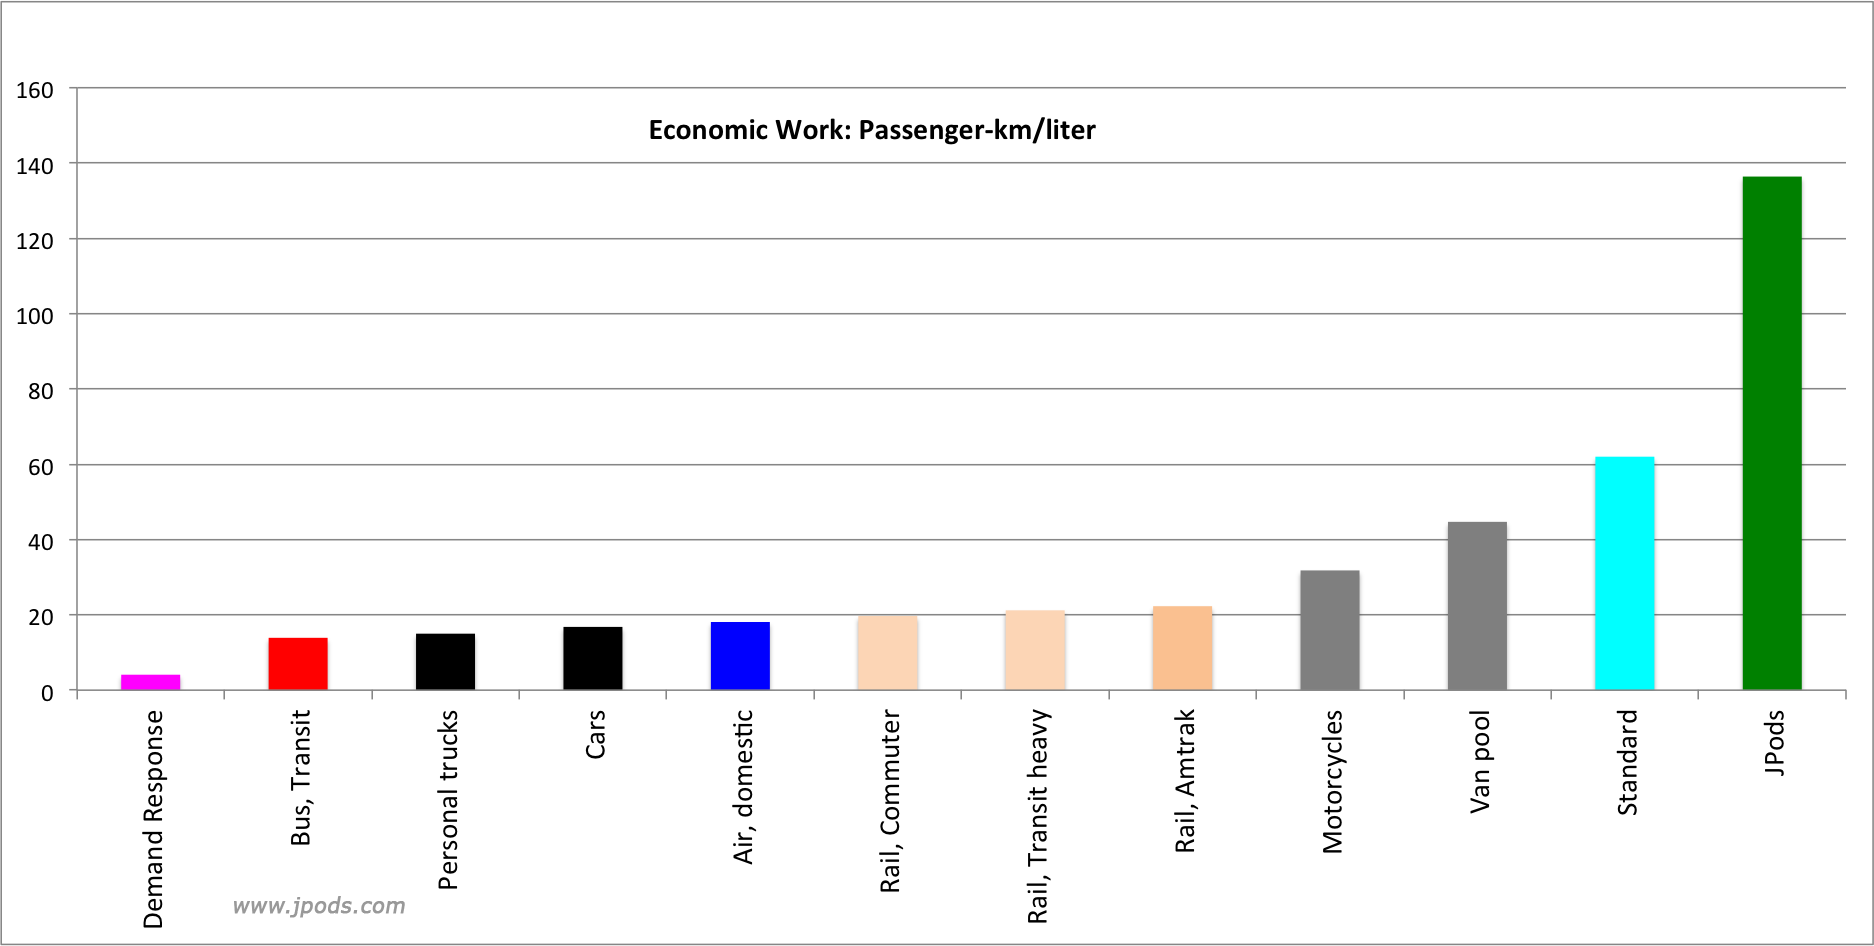
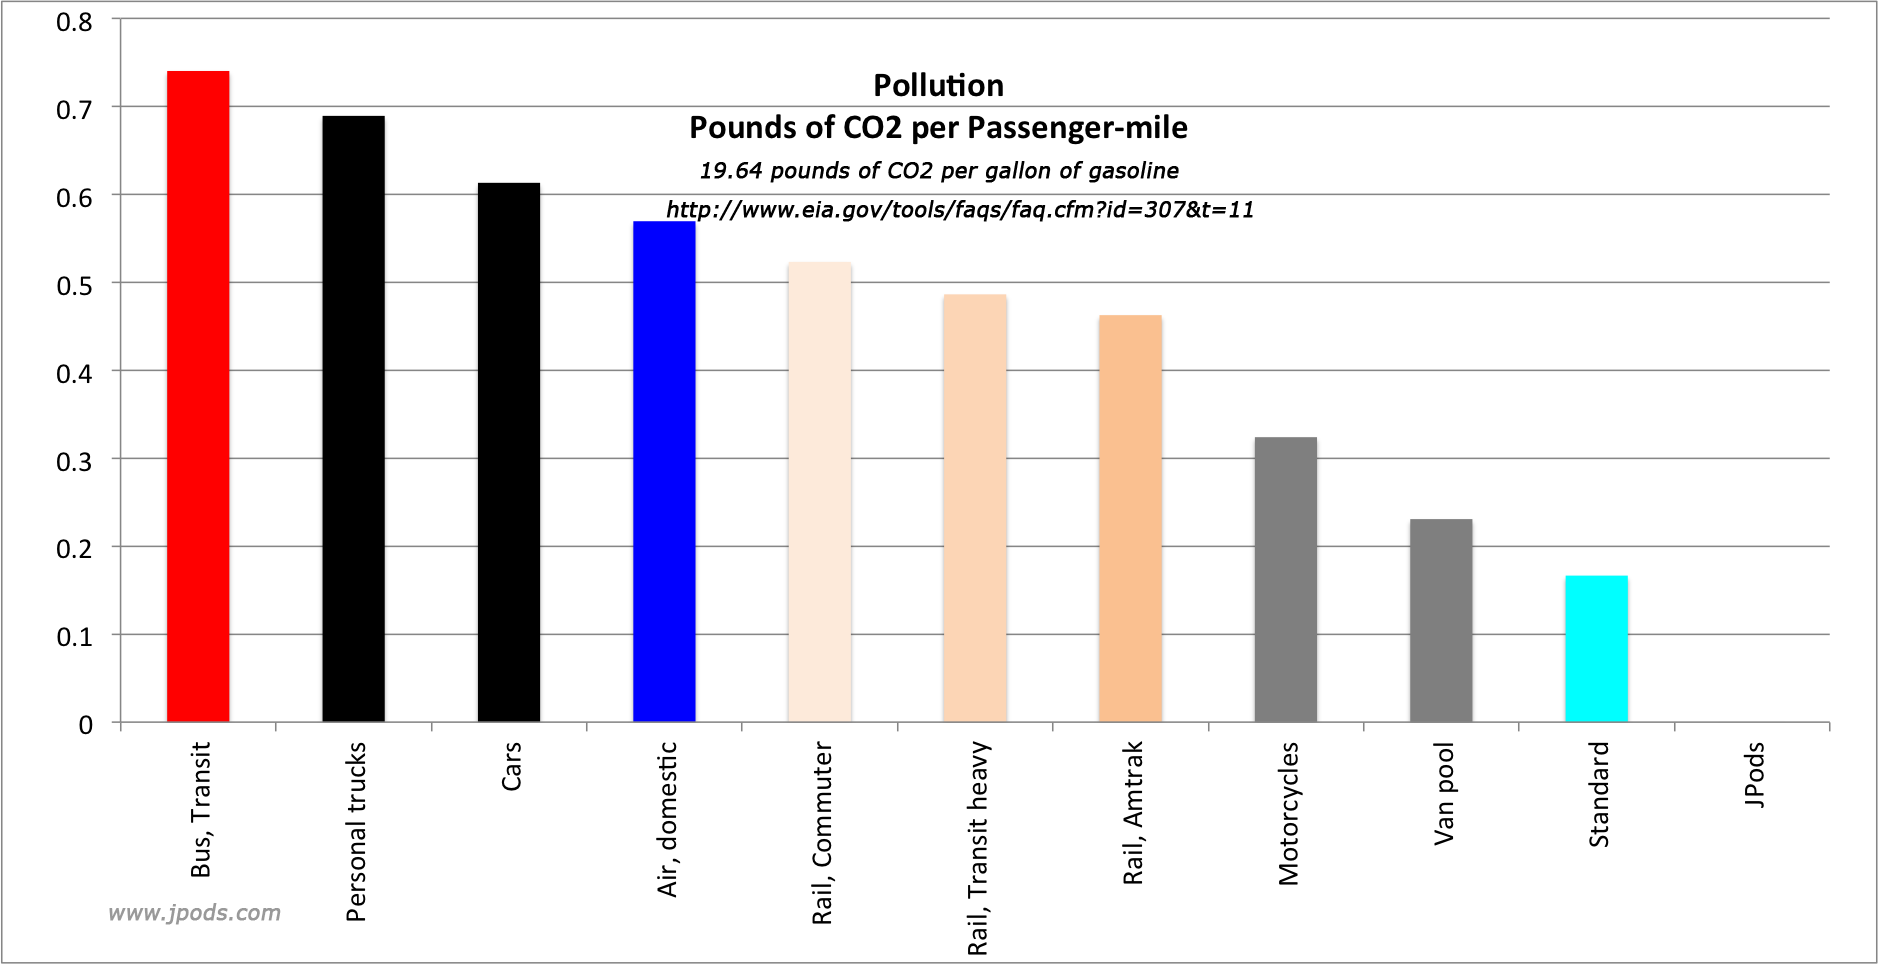
Baseline operating costs per passenger-mile
Morgantown PRT Audit
This 5 years payback is consistent with the 2010 audit of the Morgantown PRT network and Kiva systems conversion of a $33 million investment into a $775 million sale to Amazon.
Maps: Massachusetts, Oklahoma, Texas, Missouri
Simplified payback based on traffic volumes (Texas)
| cars/day | cost diff | pay v costD | Service Premium | |||||||
| 15,000 | miles/day | miles/year | cost diff | Cost years | Service Premium | |||||
| 0.7 | years | 1.2 | years | 1.5 | years | |||||
| 20 | 3,000 | 1,095,000 | 744,600 | 27 | 521,220 | 38 | 893,520 | 22 | 1,116,900 | 18 |
| 30 | 4,500 | 1,642,500 | 1,116,900 | 18 | 781,830 | 26 | 1,340,280 | 15 | 1,675,350 | 12 |
| 40 | 6,000 | 2,190,000 | 1,489,200 | 13 | 1,042,440 | 19 | 1,787,040 | 11 | 2,233,800 | 9 |
| 50 | 7,500 | 2,737,500 | 1,861,500 | 11 | 1,303,050 | 15 | 2,233,800 | 9 | 2,792,250 | 7 |
| 60 | 9,000 | 3,285,000 | 2,233,800 | 9 | 1,563,660 | 13 | 2,680,560 | 7 | 3,350,700 | 6 |
| 70 | 10,500 | 3,832,500 | 2,606,100 | 8 | 1,824,270 | 11 | 3,127,320 | 6 | 3,909,150 | 5 |
| 80 | 12,000 | 4,380,000 | 2,978,400 | 7 | 2,084,880 | 10 | 3,574,080 | 6 | 4,467,600 | 4 |
| cost diff | pay v costD | Service Premium | ||||||||
| 25,000 | miles/day | miles/year | cost diff | Cost years | Service Premium | |||||
| 0.7 | years | 1.2 | years | 1.5 | years | |||||
| 20 | 5,000 | 1,825,000 | 1,241,000 | 16 | 868,700 | 23 | 1,489,200 | 13 | 1,861,500 | 11 |
| 30 | 7,500 | 2,737,500 | 1,861,500 | 11 | 1,303,050 | 15 | 2,233,800 | 9 | 2,792,250 | 7 |
| 40 | 10,000 | 3,650,000 | 2,482,000 | 8 | 1,737,400 | 12 | 2,978,400 | 7 | 3,723,000 | 5 |
| 50 | 12,500 | 4,562,500 | 3,102,500 | 6 | 2,171,750 | 9 | 3,723,000 | 5 | 4,653,750 | 4 |
| 60 | 15,000 | 5,475,000 | 3,723,000 | 5 | 2,606,100 | 8 | 4,467,600 | 4 | 5,584,500 | 4 |
| 70 | 17,500 | 6,387,500 | 4,343,500 | 5 | 3,040,450 | 7 | 5,212,200 | 4 | 6,515,250 | 3 |
| 80 | 20,000 | 7,300,000 | 4,964,000 | 4 | 3,474,800 | 6 | 5,956,800 | 3 | 7,446,000 | 3 |
| cost diff | pay v costD | Service Premium | ||||||||
| 35,000 | miles/day | miles/year | cost diff | Cost years | Service Premium | |||||
| 0.7 | years | 1.2 | years | 1.5 | years | |||||
| 20 | 7,000 | 2,555,000 | 1,737,400 | 12 | 1,216,180 | 16 | 2,084,880 | 10 | 2,606,100 | 8 |
| 30 | 10,500 | 3,832,500 | 2,606,100 | 8 | 1,824,270 | 11 | 3,127,320 | 6 | 3,909,150 | 5 |
| 40 | 14,000 | 5,110,000 | 3,474,800 | 6 | 2,432,360 | 8 | 4,169,760 | 5 | 5,212,200 | 4 |
| 50 | 17,500 | 6,387,500 | 4,343,500 | 5 | 3,040,450 | 7 | 5,212,200 | 4 | 6,515,250 | 3 |
| 60 | 21,000 | 7,665,000 | 5,212,200 | 4 | 3,648,540 | 5 | 6,254,640 | 3 | 7,818,300 | 3 |
| 70 | 24,500 | 8,942,500 | 6,080,900 | 3 | 4,256,630 | 5 | 7,297,080 | 3 | 9,121,350 | 2 |
| 80 | 28,000 | 10,220,000 | 6,949,600 | 3 | 4,864,720 | 4 | 8,339,520 | 2 | 10,424,400 | 2 |
Capital Payback — update this
To accomplish this cost to value change will requires about 500,000 miles of JPods, Hyperloop, ET3 and other networks. This is about 4 times the amount of freight railroads (140,000 miles) and 1/4th the lane miles of urban roads (nearly 2 million). At $10 million per mile, the cost of this retooling is about $5 trillion. The effort will pay for itself about every 5 years. H
- Bikes: https://usa.streetsblog.org/2020/10/10/exactly-how-far-u-s-street-safety…
- University of Michigan, Personal Transportation Factsheet, https://css.umich.edu/publications/factsheets/mobility/personal-transpor…